2023-2024 NBA Finals & Stanley Cup Finals: Social Value Recap
While this year’s NBA Finals only went to 5 games, they still brought significant value for the teams involved. The Boston Celtics and Dallas Mavericks brought in more than $13 million combined in social value over the five-game series. There has certainly been no shortage of value across either team’s social platforms. On the other hand, the NHL’s exciting seven-game series had fans on the edges of their seats the entire series. The Florida Panthers went on a 3-0 run to kick off the series against the Edmonton Oilers, but the Oilers came back with three wins to force Game 7. However, the Panthers were able to close out the series with a hard-fought 2-1 victory over the Oilers. This was the Panther’s first Stanley Cup in the team’s 30-year history.
NBA Finals - Boston Celtics vs. Dallas Mavericks
The Boston Celtics had a solid start to the series with a 3-0 run. The Dallas Mavericks responded in Game 4 with a dominating 122-84 win over the Celtics, but unfortunately, it was too little, too late. Boston took home the trophy in Game 5 in a 106-88 win in front of their home crowd. Jaylen Brown was awarded the MVP trophy after averaging 20.8 points, 5.4 rebounds, and 5.0 assists per game throughout the series against Dallas. Jayson Tatum put up a comparable performance, but ultimately, it was decided that Brown deserved the trophy.
Over the course of the NBA Finals, the Boston Celtics brought in $10.0 million in social post value, more than double the Dallas Mavericks’ $3.6 million social post value. The Boston Celtics also brought in $33.4 million in social brand value (the aggregate brand value from all posts), almost triple what the Mavericks brought - $11.84 million. Boston was the stronger team on social media, even when you consider the regular season, where they almost always finished in the top three teams for social value (during the 2023-2024 season, they finished third behind the Los Angeles Lakers and Golden State Warriors).
Brand Value
As for top brands throughout the series (excluding league-wide jersey sponsors like Nike and Air Jordan), VistaPrint - the Boston Celtic’s jersey patch partner - held the number one spot with $2.83 million in social brand value. The brands with the next highest social brand value include YouTube with $1.77 million, Chime Financial with $1.75 million, State Farm with $1.38 million, and TD Bank with $1.30 million. The graph below shows the full breakdown of social brand value across the NBA Finals for the Dallas Mavericks and Boston Celtics.
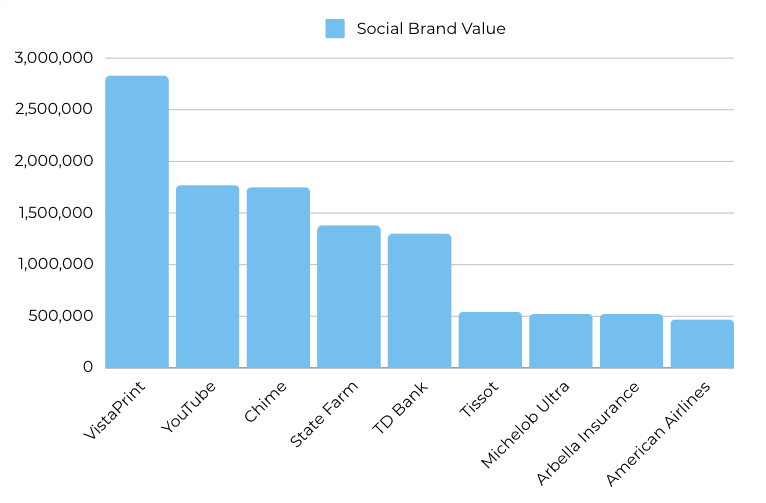
The two jersey patch sponsors, VistaPrint (Boston Celtics) and Chime Financial (Dallas Mavericks) finished in the top three for the highest brand social value. Jersey patches have proven to be one of the most valuable locations not only for social but for broadcast as well. Meanwhile, YouTube, the presenting sponsor for the Finals, finished second in the social rankings. YouTubeTV logos were featured in multiple locations, such as the court, video board between the benches, stanchions, and the score bug in the Finals. The number of locations and frequency of logo placements around the court and arena contributed to YouTubeTV’s major value from the playoffs.
Team Value
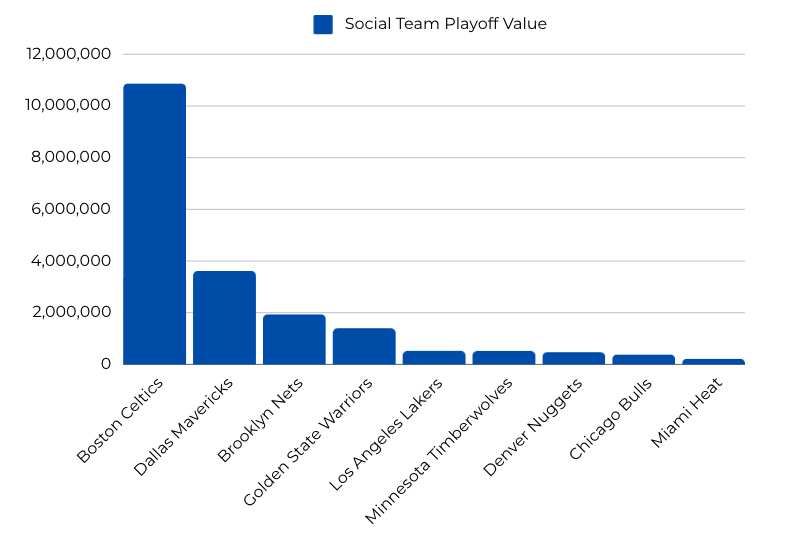
The graph above shows the rankings for the top NBA teams on social over the 2024 playoffs. Unsurprisingly, Boston and Dallas brought in the most value with $10.87M and $3.62, respectively. The Brooklyn Nets and Golden State Warriors were the only other teams to surpass $1M in social value, with $1.94M and $1.40M each. The Nets weren’t even in playoffs, but they still managed to bring in a solid amount of value. Meanwhile, other teams like the Chicago Bulls, Miami Heat, and the Los Angeles Lakers either didn’t make it out of the play-in round or lost in the first round and still managed to finish in the top 9 teams on social.
Although the NBA typically brings in steady social value throughout the playoffs each year, the NBA’s viewership hit its lowest viewership in three years, with an average of 11.3 million people watching throughout the final series between Boston and Dallas. The NBA has been struggling to get viewership rates back up to pre-pandemic levels in which the average series ratings were typically more than 16 million viewers. Some of the viewership loss has been due to streaming services beginning to compete more with the linear television networks for viewers’ attention. The NBA should look into ways to capture more viewers' attention over the next season to increase viewership.
NHL Stanley Cup Finals - Florida Panthers vs. Edmonton Oilers
The 2024 Stanley Cup Finals will surely go down as one of the most entertaining series to watch, with the Edmonton Oilers returning from a 3-0 deficit to force Game 7 against the Florida Panthers. Across the seven-game series, the Florida Panthers brought in $2.05 million in social value, and the Edmonton Oilers brought in $1.71 million. Each team had 3.4 million engagements and more than $4 million each in social brand value. While $2 million in social value for the Panthers may not seem like a lot compared to the NBA teams, this is almost $1.4 million more than the social value the Panthers brought last year in the Stanley Cup Finals series against the Vegas Golden Knights.
Brand Value
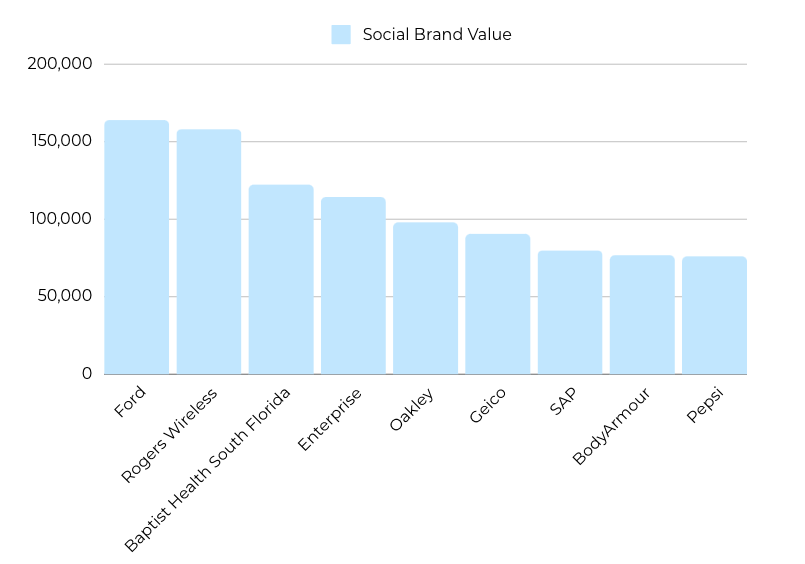
When it came to top brands for the Stanley Cup Finals, excluding league-wide jersey sponsors like CCM, Warrior, Bauer, etc., Ford led the pack with $164K in value across the series, with Rogers close behind at $158K in value and Baptist Health South Florida brought in $122.3K in value. For Baptist Health South Florida, $122K in social value may seem minimal; however, last season during the finals, Baptist Health South Florida only brought in $59.3K - meaning they more than doubled their value from the previous Stanley Cup Finals series.
This season, NHL team sponsorship revenue is up 10% from last season, which puts the NHL’s total revenue from team sponsorships at more than $1.4 billion - about equal to the NBA’s sponsorship revenue. This increase in revenue shows the growth in popularity that hockey has seen in the United States over the last year, along with the league’s decision to include digital signage assets like DEDs in its sponsorship mix. To see more on the value DEDs brought for NHL teams this past season, check out our 2023-2024 DED Report here.
Team Value
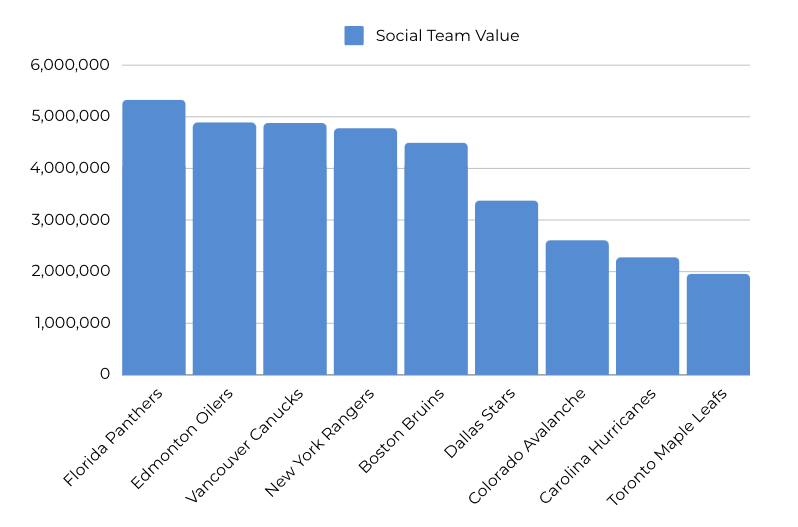
The chart above shows the breakdown for the top teams on social throughout the entire NHL playoffs. The Panthers and Oilers led the way regarding social value for the teams since they reached the Stanley Cup Finals and had the most coverage compared to other teams. The next highest valued team on social would be the teams that exited in the conference finals. However, the Vancouver Canucks, who went in the second round, actually finished third in value with $4.88M, just $10K less than the Oilers’ $4.89M. The Canucks played against the Oilers in Game 7, which brought about good engagement for the team, such as a post showing Owen Wilson attending the game, which brought in more than 44K likes. Along with having other celebrity attendees, such as Kevin James, throughout the playoffs, the Canucks’ social media team has done a stellar job at creating engaging content, from high-quality graphics to hype videos and highlight videos to videos of the team behind the scenes and more. The Canucks had the fourth-highest number of engagements out of the top 10 teams, with 8.0M engagements. This shows how valuable an engaged audience can be and the value of posting high-quality content.
Overall, the NHL may not bring in as much cumulative value as the NBA does over the season, but the future is bright for the NHL. With viewership, value, and sponsorship revenue on the rise, brands should see this as an opportunity to invest in the NHL. While hockey is already the number one sport in Canada, it is quickly growing in the US - and is often considered the 5th most popular sport in the US. Investing in hockey can be a worthwhile investment - especially if the team invested in it goes on a long run in the playoffs, as this can generate even more value.
Where does Trajektory come in?
Whether you’re tracking the NBA, NHL, or any other league, Trajektory is the premiere sponsorship analytics vendor on the market. We make it easy to track all your brands, properties, and assets in one simple, user-friendly platform. We help teams keep track of valuations for stanchions, on-court ads, in-ice ads, field board ads, social, TV broadcasts, LEDs, DEDs, static signage, shoes, jerseys, and more. This means that no matter which sport you’re sponsoring or seeing sponsorships for, our platform allows you to pinpoint top (and bottom) performing assets to report valuations and performance back to your brands at any point during the season and adjust strategies accordingly.
The Trajektory platform allows you to view your teams’ sponsorship assets and performance, compare and track the performance of other teams and brands, and benchmark performance across all assets to see where your team’s valuations stand in comparison to other teams within your league or outside of it. With Trajektory, teams can ensure they can provide accurate valuations for their brands and agencies for full sponsorship transparency.