
How Is Sponsorship Value Calculated? A Transparent, Asset Level Formula
Quick Summary & Key Takeaways
Sponsorship value is calculated by inventorying every asset a partner receives, measuring each one’s exposure (reach, frequency, and duration), applyi...
Sponsorship value is calculated by inventorying every asset a partner receives, measuring each one’s exposure (reach, frequency, and duration), applying a market rate benchmark, adjusting for placement quality and context, and summing the results into a portfolio total. The output should be traceable back to each individual asset, not delivered as one number with no visible inputs.
That’s easy to state and surprisingly hard to do consistently. Below is the full framework, a real benchmark from Trajektory’s own market data, and the most common ways sponsorship valuation goes wrong.
Why “How Much Is This Worth” Usually Gets Answered Badly
Ask most partnership teams how they arrived at a sponsorship value and you’ll get one of two answers: a vague reference to media value equivalency, or silence. Neither builds much trust with a partner deciding whether to renew.
The issue isn’t that valuation is impossible. It’s that most teams either jump straight to one blended number, or lean on an opaque methodology. A defensible valuation has to be reconstructible. Anyone should be able to trace the final figure back to the assets, exposure data, and benchmarks that produced it.
The Asset Level Valuation Formula
Instead of valuing a sponsorship as one lump sum, asset level valuation breaks it into parts, values each one, and rolls them up afterward.
Inventory every asset. List what the partner actually received, not the contract line items, but the real delivery: signage, broadcast mentions, social posts, digital placements, radio reads, in venue activations. Anything left off the list can’t be valued, which is why incomplete capture is the single biggest cause of undervaluation.
Measure exposure per asset. For each one, capture reach (the audience that could plausibly see or hear it), frequency (how many times it appeared), and duration (how long it was visible or audible per appearance). A sign shown for three seconds in the background of a broadcast carries different exposure than a full screen graphic held for fifteen, even if both get logged as “one broadcast mention” in a simpler system.
Apply a market rate benchmark. Convert exposure into a baseline dollar figure using what comparable exposure would cost to buy as advertising in that same channel. This is media value equivalency, and it’s a reasonable starting point. The mistake is treating it as the finished number instead of the baseline.
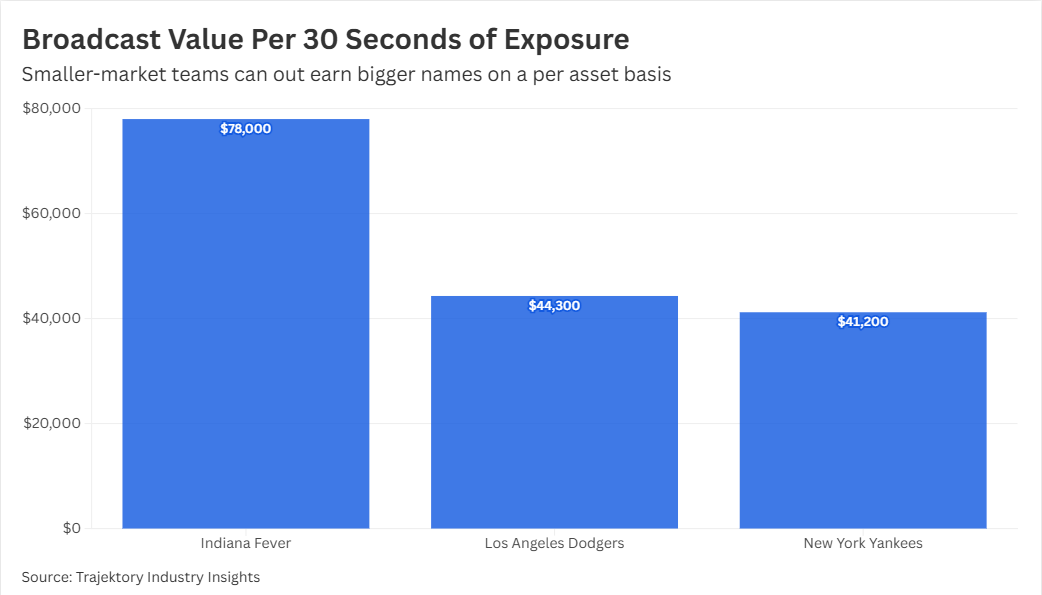
Here’s what that benchmark actually looks like in practice. Trajektory’s own Industry Intelligence data currently tracks broadcast value across pro sports, and one figure from that data set is a genuinely useful anchor: the Indiana Fever’s average value per 30 seconds of broadcast exposure sits around $78,000, compared with roughly $44,300 for the Los Angeles Dodgers and $41,200 for the New York Yankees over the same window. That’s the market rate layer of the formula, expressed as a real number instead of an abstraction. Two teams with much larger broadcast audiences than the Fever still land at a lower value per 30 seconds, because the benchmark reflects more than raw reach.
Adjust for context and placement quality. Raw media value equivalency doesn’t account for exclusivity, placement prominence, or audience relevance. A sign at midfield isn’t worth the same as one at the edge of frame, and a category exclusive deal isn’t worth the same as one competing with three other logos in the same shot. The adjustment should weigh placement prominence, category exclusivity, how relevant the audience actually is to the partner’s business, and any engagement or activation lift beyond passive exposure.
Aggregate to a portfolio total. Sum the adjusted asset values, but keep the breakdown visible. The portfolio number is what goes in the executive summary. The asset level detail is what makes it defensible the moment someone asks why.
What the Formula Looks Like Assembled
Take a hypothetical portfolio, not a real client deal, but anchored to a real benchmark instead of a made up one. Say a rights holder is valuing three assets inside one partnership, and one of them is broadcast exposure comparable to the Fever benchmark above.
A broadcast package delivering roughly two minutes of cumulative visibility, benchmarked against that $78,000 per 30 seconds figure, lands around $312,000 in base value. A social campaign running alongside it, benchmarked against a comparable team’s social post value per post, might add another $85,000. A handful of in venue signage placements, measured for duration and audience flow rather than just “presence,” might contribute a further $30,000. Add it up and the portfolio total lands near $427,000, and every piece of that number can be traced back to an asset, an exposure measurement, and a named benchmark.
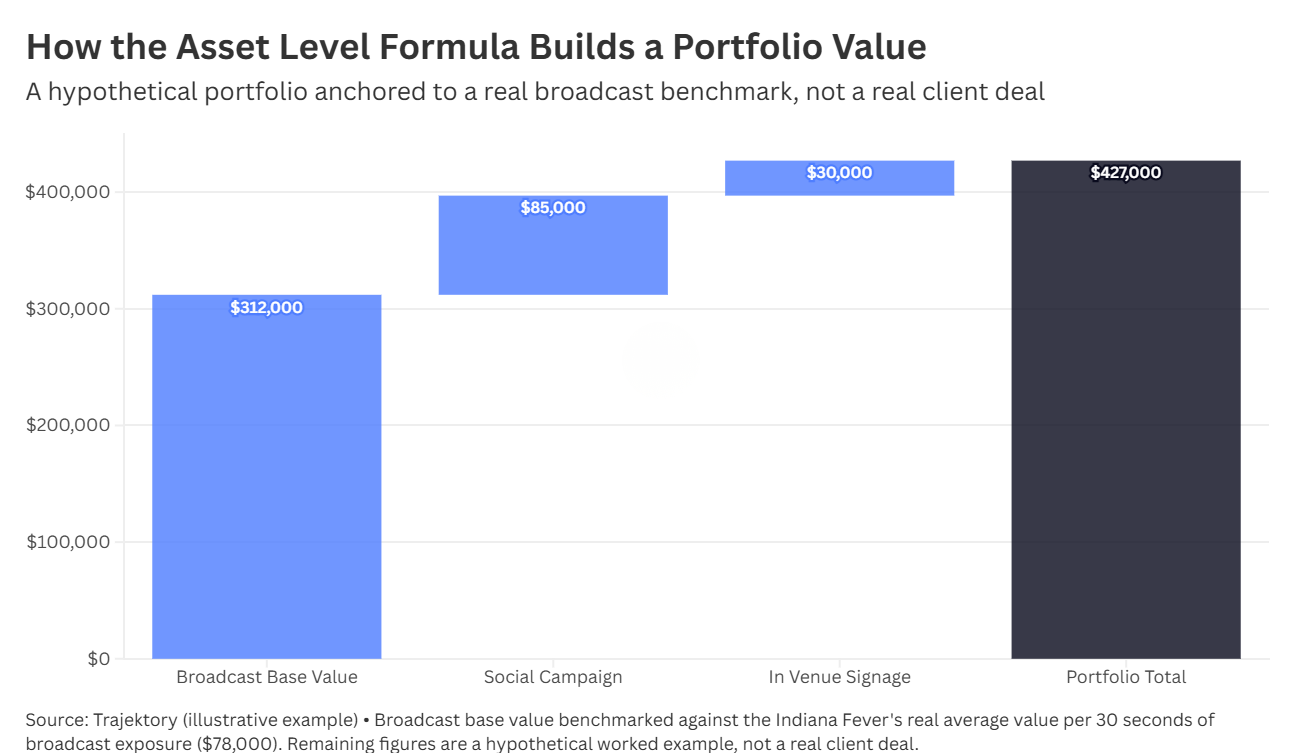
That’s the difference this framework is trying to create: not a bigger number, a number you can actually walk someone through.
Where Sponsorship Valuation Usually Breaks Down
Incomplete capture is the most common issue. Radio, in venue, and local broadcast feeds are the assets most often undermeasured, not because they’re low value, but because they’re harder to track automatically than a social post.
Treating media value equivalency as the final answer is close behind. It’s a useful benchmark, not a valuation. Skipping the context adjustment step systematically undervalues premium placements and overvalues cluttered ones.
Blending feeds causes real distortion too. A national broadcast feed and a local away market feed showing the same asset don’t deliver the same exposure. Valuing them as one collapses a real difference into a misleading average, the same trap that shows up when comparing a team like the Yankees, with far more total reach, against a team like the Fever, whose audience converts differently per unit of exposure.
And a lack of audit trail undermines the whole exercise. If the methodology can’t be walked back to individual assets, it can’t be defended in a renewal negotiation, and it shouldn’t be presented as though it can.
What to Ask Before Trusting a Valuation
Whether you’re producing the number or receiving it from a rights holder, agency, or platform, a defensible sponsorship valuation should be able to answer a few plain questions: What assets were included, and which were left out? What exposure data (reach, frequency, duration) was used for each one? What benchmark was applied, and is it actually a market comparable rate? What context adjustments were made, and why? And can the total be traced back to the individual line items, or does it just have to be taken on faith?
If the answer to any of those is “it’s proprietary” or “just trust the platform,” that’s a reason to ask more questions, not fewer.
Where This Leaves You
Sponsorship value isn’t one number. It’s a sum of clearly measured, clearly benchmarked parts, and the market data backs that up: audience size alone doesn’t determine value, engagement quality and placement context do just as much of the work, sometimes more. The teams and brands that earn the most credibility in a renewal conversation aren’t the ones with the highest valuation. They’re the ones who can show their work, asset by asset, the moment someone asks how they got there.
A good starting point is picking your three highest value partnership assets and trying to reconstruct their valuation using the steps above. If you can’t trace the number back to reach, frequency, duration, and a named benchmark, that’s exactly where to start tightening the methodology.
Trajektory built this framework because most sponsorship reporting stops at a headline number, and a headline number can’t be defended in a renewal negotiation. Our platform pulls together digital and non-digital exposure data, applies named market benchmarks like the ones above, and rolls everything up into asset level valuations that stay traceable back to the source. Whether you’re managing a handful of partnerships or an entire portfolio, Trajektory is built to show the math behind every dollar of sponsorship value.